Create Stunning Graphs
in Seconds with Al
The first AI-powered graphing calculator with a generous free tier. Create 2D, 3D, and statistical graphs using natural language. Perfect for students, teachers, and professionals. Graphgpt is an independent application built for AI-assisted visualization and learning. It is not affiliated, endorsed, or associated with OpenAI or its GPT models. The acronym “GPT” in this context stands for Generate - Project - Transform and inspires to go beyond just plotting. See the math, understand the why.
Start with 50 free AI credits. No credit card required to start.


Everything You Need for Math & Physics Visualization
Graphgpt combines cutting-edge AI with all the powerful features you expect from a premium physics graphing calculator.
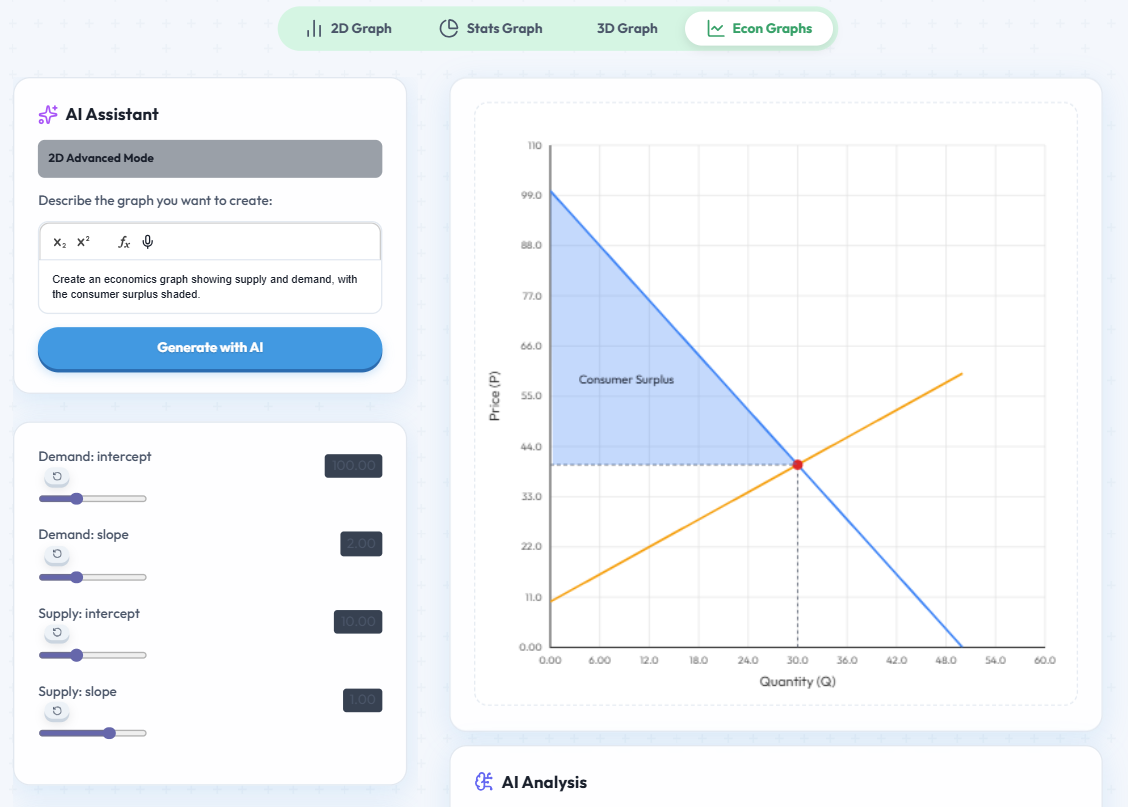
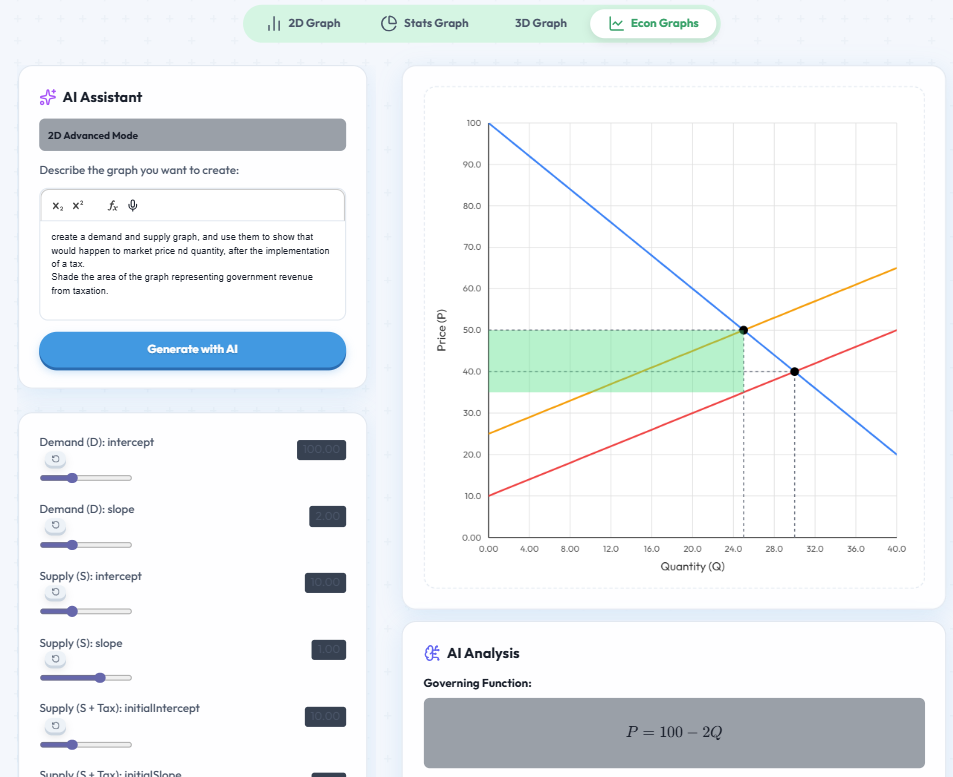
AI Graph Generation
Just type what you need. "Plot sine x from -pi to pi" or "bar chart of 2, 5, 8" and let our AI handle the syntax. (Uses AI Credits)
Voice-to-Graph Input
Go hands-free with speech recognition. Simply say your equation or command for the ultimate accessible graphing experience. (Uses AI Credits)
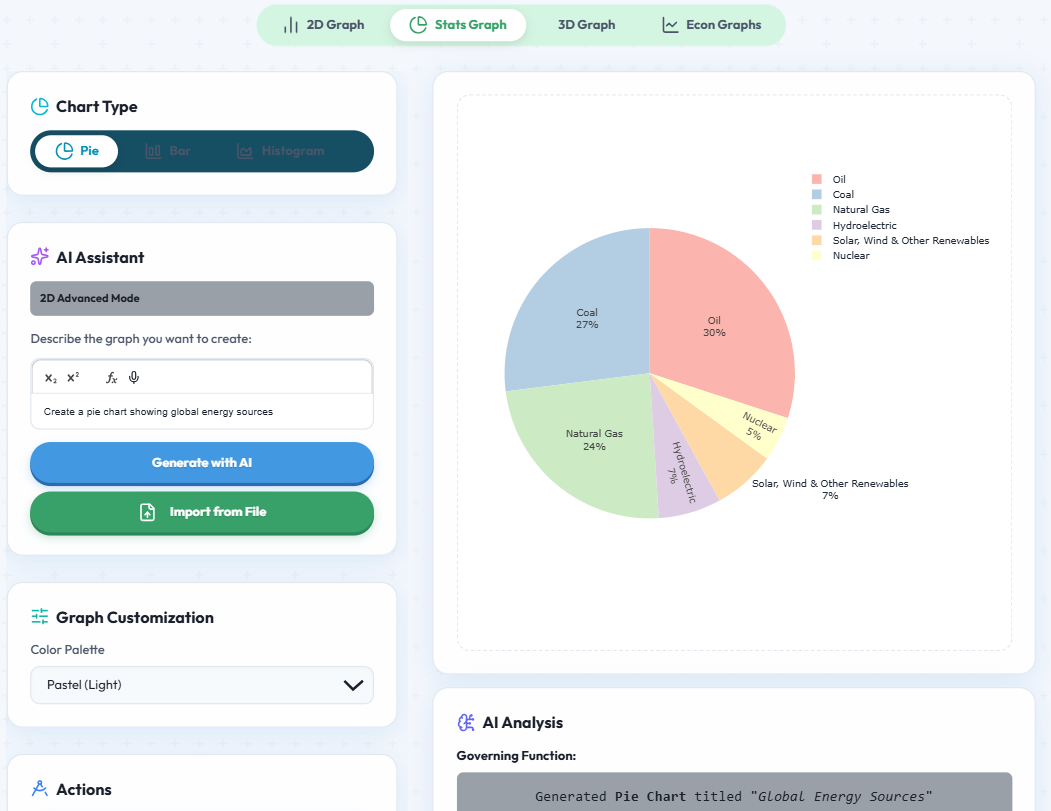
All Graph Types in One Tool
Stop switching tabs. Seamlessly create 2D graphs, interactive 3D graphs, and statistical charts all in one unified platform.
Interactive Explain Mode
Perfect for calculus. Visualize derivatives, integrals, and area under the curve with interactive sliders and explanations.
Live Annotation Tools
Draw, type, and highlight directly on your graphs. Ideal for classroom presentations or sharing detailed analysis with colleagues.
Cloud Sharing & Embedding
Generate a shareable link to your graph or get an iframe embed code to integrate directly into your LMS, blog, or website.
Find the Plan That's Right for You
Start for free and upgrade when you need more power. All standard graphing features are free for everyone.
Free
For casual users and students
Start for Free- 50 AI Credits on signing up
- All 2D, 3D & Stats Graphing
- Live Annotation Tools
- Cloud Sharing & Embedding
Plus
For advanced students & educators
Get Started- 3000 AI Credits / month
- All 2D, 3D & Stats Graphing
- Live Annotation Tools
- Cloud Sharing & Embedding
- Priority Support
Pro
For professionals & researchers
Get Started- 7000 AI Credits / month
- All 2D, 3D & Stats Graphing
- Live Annotation Tools
- Cloud Sharing & Embedding
- Priority Support
Max
For power users
Get Started- 14000 AI Credits / month
- All 2D, 3D & Stats Graphing
- Live Annotation Tools
- Cloud Sharing & Embedding
*AI Credits are used for "Generate with AI" and "Import file to generate graph" features. Standard manual graphing is always free and does not consume credits. Credits reset monthly.
Why Choose Graphgpt Over Other Graphing Calculators?
See how our AI graphing calculator stacks up against the old standards.
| Feature | Graphgpt | Desmos | GeoGebra |
|---|---|---|---|
| AI Natural Language Assistant | |||
| Voice-to-Graph Input | |||
| Integrated 3D Graphing | |||
| Statistical Chart Creator | |||
| Beginner-Friendly UI | |||
| Pricing | Freemium | 100% Free | 100% Free |
Perfect for Every Learning & Working Style
A powerful graphing calculator for students, teachers, and professionals alike.
For Students
Visualize complex calculus, physics, and algebra concepts for homework. Use your free daily credits to check your work and understand functions faster.
Ace Your HomeworkFor Teachers
Create engaging interactive lessons. Annotate graphs live in class and share them directly to your LMS. Use AI credits to instantly generate examples.
Enhance Your ClassroomFor Professionals
From data science to engineering, create publication-quality charts. Use AI credits to import data files and generate plots instantly.
Streamline Your WorkflowAI Based Graphing Calculator
Start from Our Template Gallery
Don't start from scratch. Load one of our pre-built templates for common physics and math graphs. (Does not use AI credits)
Sine & Cosine Waves
A simple plot comparing two trigonometric functions, sin(x) and cos(x).
Load TemplateFrom Idea to Interactive Tool

About Graphgpt
Graphgpt was born from a simple idea: data visualization should be intuitive, not intimidating. As a developer and educator I am passionate about making complex data accessible to everyone.
This tool is built for the learner trying to understand physics, the analyst needing a quick chart, and the professional creating a presentation. It's the graph generator we always wished we had.The term “GPT” in GraphGPT is uniquely interpreted as Generate - Project - Transform, symbolizing our mission to empower data visualization through generative computation. Graphgpt does not employ, reproduce, or rely on OpenAI’s GPT technology or their APIs. All algorithms and AI systems integrated in Graphgpt utilize original computation pipelines and third‑party large‑language‑model infrastructures such as Gemini. Any resemblance to other ‘GPT’ products is coincidental and denotes the generic abbreviation for generative or intelligent technologies.

Our Purpose & Vision
Our Purpose: To empower curiosity by making data visualization as simple as asking a question.
Our Vision: A world where anyone, regardless of technical skill, can instantly turn their ideas and data into beautiful, insightful visualizations. We're just getting started.
Ready to Start Visualizing?
Join students, teachers, and professionals who use Graphgpt to bring their data to life. Start with 50 free AI credits to explore before you decide.
Start Graphing for Free